Google Search

Monday, October 25, 2010

PID Design Method

Objective:

· To study PID design.

Theory:

There are several technique available to the control system engineers to design a suitable controller. One of them widely used is the proportional plus integral plus derivative (PID) controller, which has the transfer function:

Kp=Propotional gain.

KI=Integral gain.

KD=Derivative gain.

MatLab Code:

clear all;

close all;

figure;

num=1;

den=[1 10 20];

sys=tf(num,den);

step(sys);

grid

Title('Step Response for the Open Loop System');

xlabel('Time')

ylabel('Speed');

figure;

num=50;

den=[1 10 70];

sys=tf(num,den);

step(sys);

hold on;

num=100;

den=[1 10 120];

sys=tf(num,den);

step(sys);

hold on;

num=150;

den=[1 10 170];

sys=tf(num,den);

step(sys);

grid

Title('Step Response for Proportional Controller Closed Loop System');

xlabel('Time')

ylabel('Speed');

figure;

num=[25 12];

den=[1 10 45 12];

sys=tf(num,den);

step(sys);

hold on;

num=[50 48];

den=[1 10 70 48];

sys=tf(num,den);

step(sys);

hold on;

num=[75 108];

den=[1 10 95 108];

sys=tf(num,den);

step(sys);

hold on;

num=[100 192];

den=[1 10 120 192];

sys=tf(num,den);

step(sys);

grid

Title('Step Response for Proportional Integral Controller Closed Loop System');

xlabel('Time')

ylabel('Speed');

figure;

num=[5 20];

den=[1 15 40];

sys=tf(num,den);

step(sys);

hold on;

num=[10 40];

den=[1 20 60];

sys=tf(num,den);

step(sys);

hold on;

num=[15 60];

den=[1 25 80];

sys=tf(num,den);

step(sys);

hold on;

num=[20 80];

den=[1 30 100];

sys=tf(num,den);

step(sys);

grid

Title('Step Response for Proportional Derivative Controller Closed Loop System');

xlabel('Time')

ylabel('Speed');

figure;

num=[5 25 50];

den=[1 15 45 50];

sys=tf(num,den);

step(sys);

hold on;

num=[10 50 100];

den=[1 20 70 100];

sys=tf(num,den);

step(sys);

hold on;

num=[15 75 150];

den=[1 25 95 150];

sys=tf(num,den);

step(sys);

hold on;

num=[20 100 200];

den=[1 30 120 200];

sys=tf(num,den);

step(sys);

grid

Title('Step Response for Proportional Integral Derivative(PID) Controller Closed Loop System');

xlabel('Time')

ylabel('Speed');

MatLab Data:

Report:

Give the inferences on the effects of proportional, integral and derivative control upon system performances such as rise time, overshoot, settling time and steady state error.

Is it possible to redesign the above PID controller with another set of Kp, KI and KD? If possible, design the controller.

Yes, it is possible to redesign the PID controller with another set of Kp, KI and KD.

Design of the PID controller:

MatLab Code:

clear all;

close all;

num=[10 100 200];

den=[1 20 120 200];

sys=tf(num,den);

step(sys);

hold on;

num=[10 100 175];

den=[1 20 120 175];

sys=tf(num,den);

step(sys);

hold on;

num=[7 50 90];

den=[1 17 70 90];

sys=tf(num,den);

step(sys);

Grid

title('Step Response for Redesign the PID Controller Closed Loop System');

xlabel('Time')

ylabel('Speed');

Kp

KD

KI

Rise

Time

(Sec)

Overshoot

(%)

Settling

Time

(Sec)

Steady

State

Error

(%)

100

100

50

10

10

7

200

175

90

0.2194

0.2304

0.5695

1.030

0.529

0.829

0.395

0.543

1.080

0.0

0.0

0.0

These designs fulfill our system requirments. So these can be a useful alternative of the given design of the system. The proposed design will be more economical and simple.

Monday, October 18, 2010

Modeling of a DC Motor and Study of it's Open Loop Response

Physical Interpretation & System Equations:

A common actuator in control systems is the DC motor. It directly provides rotary motion and coupled with wheels or drums and cables can provide transitional motion. The electric circuit of the armature and the free body diagram of the rotor are shown in the following figure.

The motor torque T, is related to the armature current, I by a constant factor Kt. The back emf, e, is related to the rptational velocity by the following equations.

T=Kti

e=Keθ

From the figure, we can write the following equations.

Where,

J=moment of inertia of the rotor.

b=damping ratio of the mechanical system.

K=Kt=Ke=electromotive force constant.

R=electric resistance.

L=electric inductance.

V=source voltage.

θ=position of shaft.

Mathematical Analysis:

Using Laplace transforms on the above modeling equations, we get

MatLab Code:

clear all;

close all;

J=0.01;

b=0.1;

K=0.01;

L=0.5;

V=20;

figure;

for R=2:2:10

num=K;

den=[(J*L) ((J*R)+(L*b)) ((b*R)+(K*K))];

sys=tf(num,den);

step(V*sys);

hold on

grid

title('Step Response for the Open Loop System (DC Motor) When R is Varied');

xlabel('Time')

ylabel('Speed');

end

figure;

R=10;

for V=4:4:20

num=K;

den=[(J*L) ((J*R)+(L*b)) ((b*R)+(K*K))];

sys=tf(num,den);

step(V*sys);

hold on

grid

title('Step Response for the Open Loop System (DC Motor) When V is Varied');

xlabel('Time')

ylabel('Speed');

end

MatLab Data:

Resistance

(R)

Voltage

(V)

Rise Time

(Tr)

Settling Time

(Ts)

2

4

6

8

10

20

20

20

20

20

10

10

10

10

10

4

8

12

16

20

Report:

Determine the maximum speed that the motor can achieve and time to reach that speed when 1 volt is applied?

When 1 volt is applied and when resistance is 1 ohm, maximum speed is 0.0996 unit and time to reach the speed is 2.8 time units.

How steady state speed and settling time of the output response vary with the variation of R and input voltage?

When Resistance was Varied:

· Steady state speed of the system increases with decrement of resistance and vice-versa.

· Relation of rise time to resistance variation has similar characteristics, i.e. they are inversely related, when resistance increases rise/settling time falls and when resistance is reduced rise/settling time rises.

When Input Voltage was Varied:

· Steady state speed increases with increase in input voltage and conversely.

· Rise/settling time is invulnerable to input voltage change.

Can you suggest any modification in the system if we want to increase the steady state speed and reduce the settling time simultaneously?

If we increase the input voltage and the value of R at the same time, we can increase the steady state speed and reduce the settling time simultaneously. But it contradicts two different ideas. Firstly it’s not wise to change resistance of a well built system and also not convenient economically. Secondly, when change in R and input voltage are related when it’s required to increase the steady state speed and decrease the steady state speed, a feedback loop is a must, which is a must for closed loop system but should not be present in an open loop system.

As the given system is an open loop system. It can’t provide any kind of process to increase the steady state speed and to decrease the settling time at the same time.

Discussion:

In this experiment, we studied modeling of physical systems and their open loop response.

Describing a System:

The systems are usually dynamic by nature, one such model relating the input and output is the linear, time variant differential equation.

Use of Laplace Transform:

However, the classical approach of modeling linear systems is the transfer function technique which is derived from the differential equation using Laplace transform. Transfer function yield more intuitive information than the differential equation by visualizing the effect of system parameter variations on the system response as well as it eases the modeling interconnected systems.

In our experiment, we modeled a cruise control system and a dc motor and also studied their open loop response. We used software simulation (MATLAB) for this purpose. We also studied how the response changed with the change of different variables.

Open Loop System:

An open loop system utilizes an actuating device to control the process directly without using feedback. Here the final output is not compared with the desired one.

Block Diagram of Open Loop System:

Advantages of Open Loop System:

· Reduction of cost

· Simple

· Control is easy

Disadvantage of Open Loop System:

· No compensation for disturbance.

Closed Loop System:

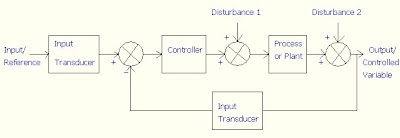
A closed loop control system uses a measurement of the output and feedback of this signal to compare it with the desired input.

Block Diagram of Closed Loop System:

Advantages of Closed Loop System:

· Greater accuracy

· Less sensitive to noise, disturbance and changes in environment

· Control is more convenient and flexible

Disadvantages of Closed Loop System:

· Costly

· Complex system

· Sometimes unstable

Friday, October 1, 2010

Modeling of Physical Systems and Study of their Open Loop Response

Objective:

The objective of this experiment is the modeling of physical systems and study of their open loop response.

Simulation of a Cruise Control System

Physical Interpretation & System Equations:

Let us assume a car that travels only in one direction. Control to the car was applied in such away that it has a smooth start up, along with a constant-speed ride.

If it is assumed that friction is opposing the motion of the car, then the modeling equations become,

mv’+bv=u

y=v

Mathematical Analysis:

Taking the Laplace transform of the equations, we find

msV(s)+bV(s)=U(s)

Y(s)=V(s)

Substituting V(s) in terms of Y(s)

msY(s)+bY(s)=U(s)

The transfer function of the system becomes

MatLab Code:

clear all;

close all;

b=100;

u=500;

figure;

for i=1:5

m=300*i;

num=[1];

den=[m b];

sys=tf(num,den);

step(u*sys);

hold on

grid

title('Step Response of the Cruise Control when Friction is Fixed');

xlabel('Time');

ylabel('Velocity (m/s)');

end

figure;

m=1500;

for j=1:5

b=20*j;

num=[1];

den=[m b];

sys=tf(num,den);

step(u*sys);

hold on

grid

title('Step Response of the Cruise Control when Mass is Fixed');

xlabel('time')

ylabel('Velocity (m/s)');

end

MatLab Simulation:

MatLab Data:

Mass (m)

Friction (b)

Rise Time (Tr)

Settling Time (Ts)

300

600

900

1200

1500

100

100

100

100

100

06.588

13.163

19.746

26.430

32.810

11.8

23.6

35.3

46.6

58.5

1500

1500

1500

1500

1500

20

40

60

80

100

166.10

83.87

54.37

41.23

33.25

289

144

97.3

72.2

58.1

Report:

Define rise time, settling time, percentage overshoot and steady state error of a system for step input.

Rise Time, Tr:

The time required for the response to go from 10% of the final value to 90% of the final value is known as rise time. It is denoted by Tr. For a step input, the output is naturally expected to reach at the final value gradually instead of impulsive response.

Settling Time, Ts:

The time required for the transient’s damped oscillations to reach and stay within ±2% of the steady state value is known as settling time. It is denoted by Ts.

Percentage Overshoot, %OS:

The amount that, the response overshoots, the steady state or final value at the peak time, expressed as a percentage of the steady state value. It is expressed in percentage form as,

For a unit step input, Mpt is the peak value of the time response, and fv is the final value of the response.

Steady State Error:

Steady state error is the difference in level between the response desired for the input command and steady state final response.

From the plot, observe the steady-state speed of the vehicle and the time it takes to reach the value.

The plot has been attached with the report. From the plot, following observations are made:

Mass (m)

Friction (b)

Settling Time (Ts)

Steady State Speed (m/s)

300

600

900

1200

1500

100

100

100

100

100

11.8

23.6

35.3

46.6

58.5

1500

1500

1500

1500

1500

20

40

60

80

100

289

144

97.3

72.2

58.1

How steady state speed, rise time and overshoot of the output response vary with the variation of m and b?

When Mass was Varied:

· Steady state speed of the system remains unchanged with the variation of the mass of the system. So, steady state speed is immune to mass change of the system.

· Rise time reacts to mass change. When the mass increases, rise time of the system increases and when the mass of the system decreases, rise time of the system decreases. So a system with small mass will rise to the steady state faster than the system with a large mass.

· No overshoot was seen in the given system.

When Friction was Varied:

· Steady state speed increases with decrease in friction & decreases with increase in friction.

· Rise time increases with decrease in b & decreases with increase in b.

· No overshoot was observed in the given system.

Justify the steady state speed of the vehicle depends only on the friction coefficient b.

In the cruise control system, it has been assumed that the vehicle travels only in one direction. If the inertia of the wheels is neglected, then the steady state speed of the vehicle depends on the friction coefficient b and the mass of the body m. According to the classical theory of mechanics, mass of a body is a constant quantity and it cannot be changed when it is running. So, from the equation it is clear that the steady state speed of the vehicle depends only on the friction coefficient b. It decreases when b increases when b decreases, cause friction or damping always works against motion. It is also seen from the plots obtained by software simulation that any change in m doesn’t change the steady state speed. So, it is decidable that the steady state speed of the vehicle depends only on the friction coefficient b, not on the mass of the system, m.

Earn Money Online

I have something interesting for you - you can easily earn regular income online via PaisaLive.com!

It’s really amazing! You get paid to open & read the contents of PaisaLive mails. You also receive special discount coupons, promotions and free passes to various events in your city.

Join now and get Rs. 99 instantly, just for joining. What more, as a special bonus you get paid for inviting your friends also!

Create your PaisaLive Account & refer your friends to earn launch referral bonus on every new registration.

Earn upto Rs. 9,000 pm with PaisaLive.com!

PaisaLive - Get Paid to read emails

Md. Rashadul Islam